

Why you cannot debug an AI agent from its final answer, and how to record every step with Langfuse.
AI Agent’s behavior is non-deterministic. We all know that.
Every AI agent is different: An agent loop, set of tools, and the AI model/LLM used as the brain of the system. It creates a specific operations problem.
You cannot reproduce a failure from the input alone. You need a record of every step.
This article shows how to build that record with Langfuse.
You will build a small agent. You will then instrument it, step by step. At the end, you will see every model call, every tool call, every cost, and every quality score for each run.
The problem: an agent is non-deterministic
In a simple scenario where there is directly an LLM API call the debugging is simple. You send a prompt and you get the response.
However, an agent system is different. An agent runs a loop. The model picks a tool. The harness runs the tool. The model/orchestrator sees the result and picks the next step. Three problems follow from this design.
- First, the agent can pick the wrong tool, read the wrong file, or loop on a failing step. The final output can still look correct. Only the full path shows the fault.
- Second, the agent decides its own cost. Each run makes its own choices. One run makes two tool calls. The next run can make 20. Cost and latency might change per run.
- Third, small errors compound. A step that is 99% reliable still fails often enough over 50 steps. The agent needs feedback inside the loop to correct itself.
Traditional logging does not solve these problems. It does not show structure, cost, or timing. You need structured traces.
What Langfuse records
Langfuse is an open-source AI engineering platform. It records structured traces of every step. It works with the Python and JavaScript SDKs, with OpenTelemetry, and with more than 100 framework integrations.
It has 34.2k stars on GitHub, and used by 21 of Fortune 50 companies with 90B+ observations/month.
Before moving forward please see these terms. These terms appear throughout this article.
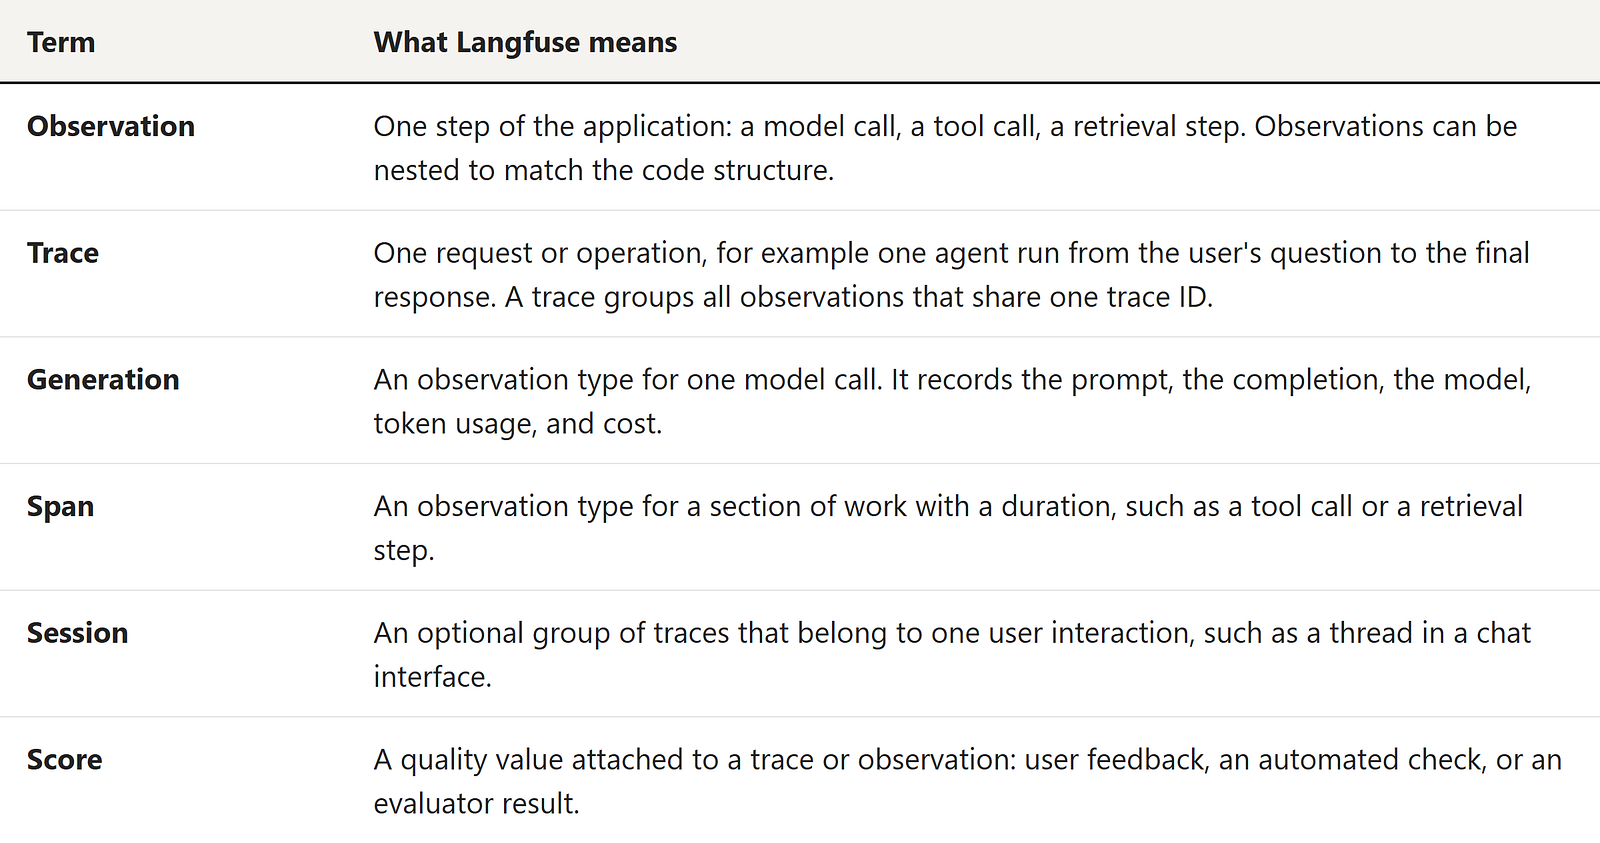
Langfuse supports ten observation types. The most useful for agents are agent, tool, generation, retriever, and guardrail. These types make traces filterable. You can query "all guardrail checks that failed" or "all runs with more than 10 tool calls".
Prerequisites
You need these items:
- Python 3.10 or later
- A Langfuse account. Use Langfuse Cloud or self-host the platform
- Langfuse API keys from the project settings
- An OpenAI API key, or any other model provider — The demo uses the free model nvidia/nemotron-3.5-lightning:free from OpenRouter.
Here are the steps:
Step 1: Install the SDK and set the credentials
Install the packages:
pip install langfuse openaiSet the Langfuse credentials as environment variables:
LANGFUSE_SECRET_KEY="sk-lf-..."
LANGFUSE_PUBLIC_KEY="pk-lf-..."
LANGFUSE_BASE_URL="https://cloud.langfuse.com" # 🇪🇺 EU region
# Other Langfuse data regions include 🇺🇸 US: https://us.cloud.langfuse.com, 🇯🇵 Japan: https://jp.cloud.langfuse.com and ⚕️ HIPAA: https://hipaa.cloud.langfuse.com
These are terminal environment variables. Alternatively, put them in a .env file and load it with python-dotenv.
Note: Use the region that matches your account. If your console shows ‘Failed to export span batch … 401’, your LANGFUSE_BASE_URL region does not match your API keys.
The SDK reads these variables at start time. It sends trace data in the background.
Step 2: Build a minimal agent, and run it twice
This agent answers questions about internal meeting notes. It has two tools and a step limit.
import json
import ast
from langfuse.openai import openai
client = openai.OpenAI(
base_url="https://openrouter.ai/api/v1",
api_key="sk-or-...", # any OpenAI-compatible provider works
)
SYSTEM_PROMPT = (
"You are a support agent. Answer only from the meeting notes. "
"Use the calculator for arithmetic. Stop when you have the answer."
)
MODEL = "nvidia/nemotron-3.5-lightning:free" # free tier; needs tool calling
TOOLS = [
{
"type": "function",
"function": {
"name": "search_notes",
"description": "Search internal meeting notes by keyword",
"parameters": {
"type": "object",
"properties": {
"query": {"type": "string"},
},
"required": ["query"],
},
},
},
{
"type": "function",
"function": {
"name": "calculate",
"description": "Evaluate an arithmetic expression",
"parameters": {
"type": "object",
"properties": {
"expression": {"type": "string"},
},
"required": ["expression"],
},
},
},
]
NOTES = {
"budget": "Q3 budget review. Marketing spend: $42,000. Infra spend: $18,500.",
"roadmap": "Q4 roadmap sync. Teams agreed to delay the mobile redesign to Q1.",
}
def search_notes(query: str) -> str:
for key, text in NOTES.items():
if key in query.lower():
return text
return "No notes found."
def calculate(expression: str) -> str:
try:
node = ast.parse(expression, mode="eval")
for n in ast.walk(node):
if not isinstance(n,(ast.Expression, ast.BinOp, ast.UnaryOp,
ast.Constant, ast.Add, ast.Sub, ast.Mult,
ast.Div, ast.USub, ast.UAdd)):
return "Error: only arithmetic is allowed"
return str(eval(compile(node, "<expr>", "eval")))
except Exception as e:
return f"Error: {e}"
def execute_tool(name: str, arguments: str) -> str:
args = json.loads(arguments)
if name == "search_notes":
return search_notes(args["query"])
if name == "calculate":
return calculate(args["expression"])
return f"Unknown tool: {name}"
def run_agent(question: str, max_steps: int = 5) -> str:
messages = [
{"role": "system", "content": SYSTEM_PROMPT},
{"role": "user", "content": question},
]
for _ in range(max_steps):
response = client.chat.completions.create(
model=MODEL,
max_tokens=1200,
messages=messages,
tools=TOOLS,
)
message = response.choices[0].message
messages.append(message)
if not message.tool_calls:
return message.content
for tool_call in message.tool_calls:
result = execute_tool(tool_call.function.name, tool_call.function.arguments)
messages.append(
{
"role": "tool",
"tool_call_id": tool_call.id,
"content": result,
}
)
return "Step limit reached. Escalate to a human."
print(run_agent("What was the total Q3 spend?"))
from langfuse import get_client
get_client().flush() # send all buffered traces before the script exitsRun this program twice. The model can pick the tools in a different order. It can skip the calculator. It can search twice. The final answer may or may not be the same. Maybe every time the path the agent takes is not the same. This is the monitoring problem we are trying to solve with the help of observability tools such as Langfuse.
Step 3: Turn the loop into a trace
Langfuse instruments code with the observe decorator. Each decorated function becomes an observation.
@observe is Langfuse’s instrumentation wrapper. You decorate a function, and on every call Langfuse records one observation automatically. No manual code inside the function. Per call, it captures:
- the function name (becomes the observation name: run_agent, execute_tool)
- the input: the arguments as they were passed (question, max_steps)
- the output: the returned value (e.g. “The total Q3 spend was $60,500.” or the tool result string)
- the start time, end time, and duration
- any error, if the function raises
Decorated functions nest automatically, so the trace tree matches the call structure.
Now add two decorators in the code above. The loop function becomes an agent observation. The tool executor becomes a tool observation.
from langfuse import observe@observe(as_type="agent")
def run_agent(question: str, max_steps: int = 5) -> str:
# unchanged loop from Step 2
...
@observe(as_type="tool")
def execute_tool(name: str, arguments: str) -> str:
# unchanged dispatch from Step 2
...Run the program again. Open the Langfuse UI.
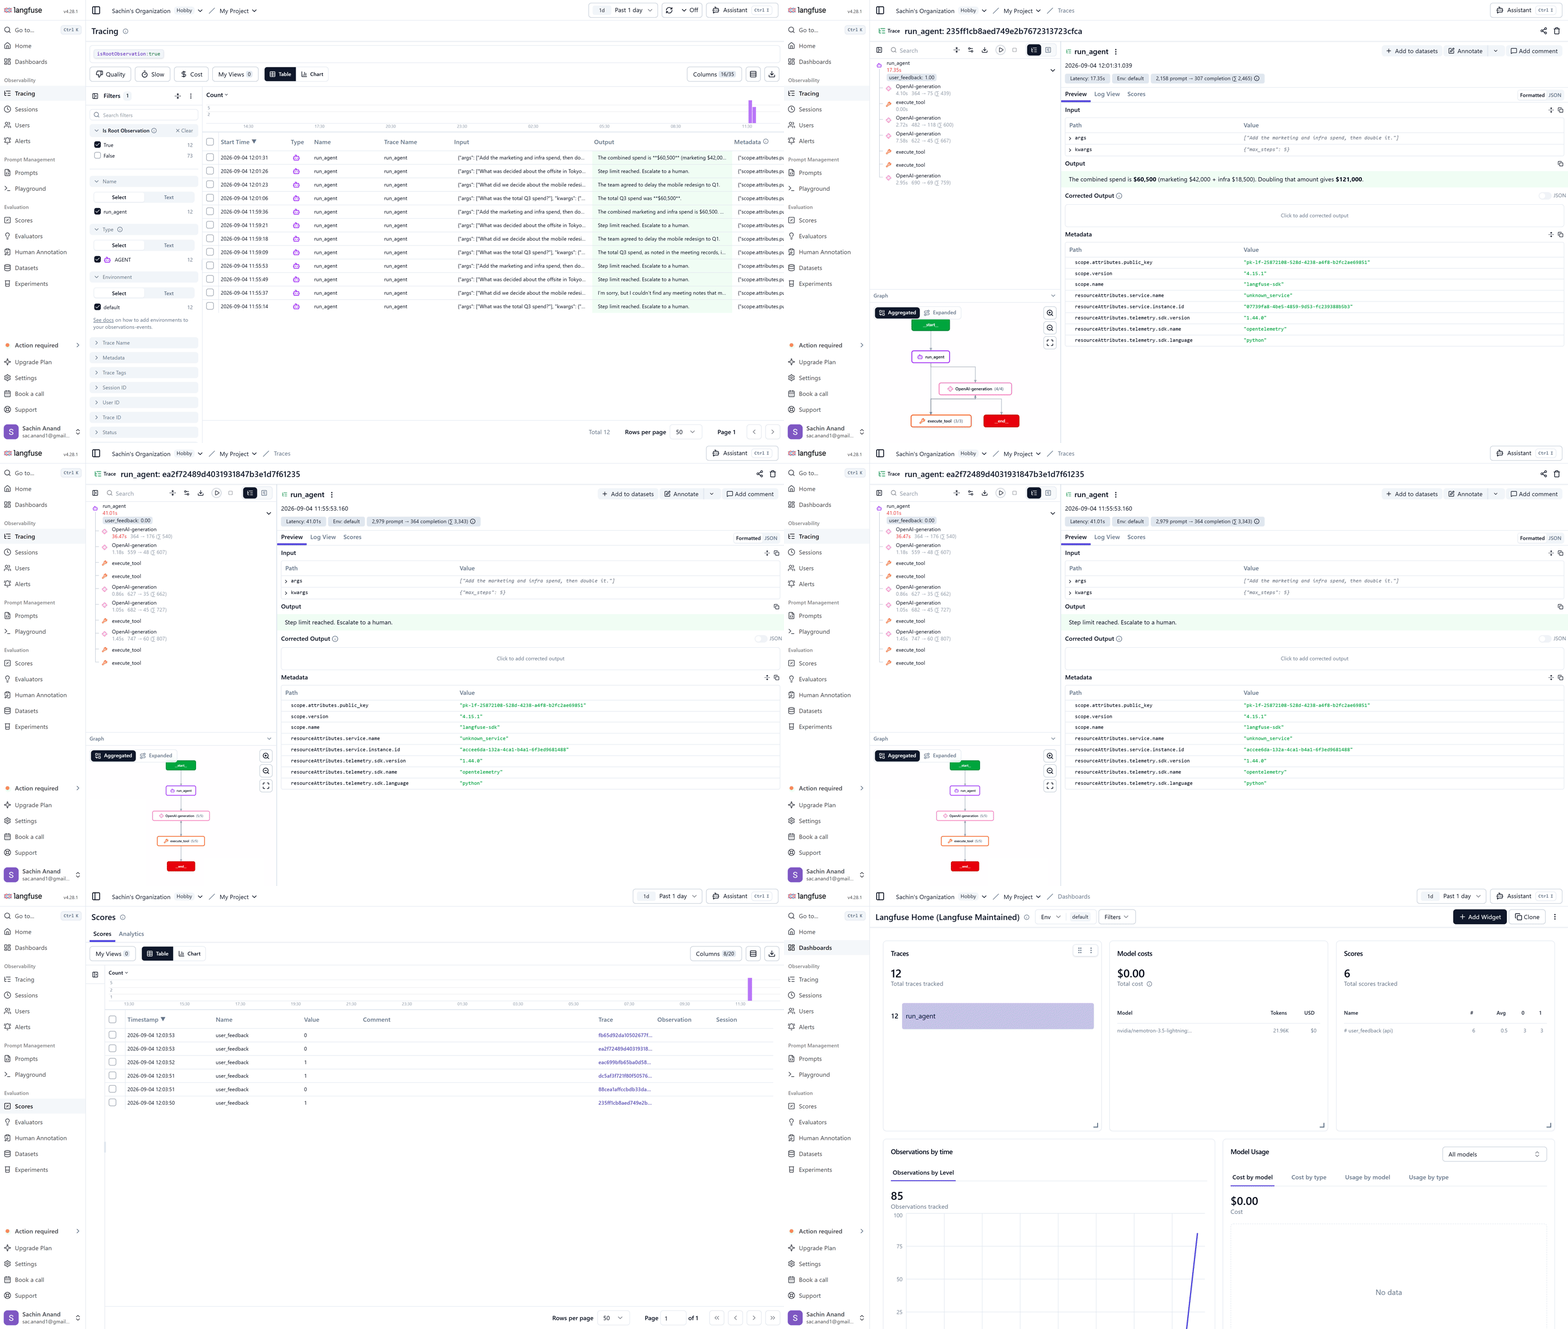
The traces live under your project’s Tracing page:
https://<your-langfuse-host>/project/<your-project-id>/tracesOn Langfuse Cloud, the simplest way is to open your project in the browser and click Tracing in the left sidebar. Self-hosted with Docker Compose defaults to http://localhost:3000.
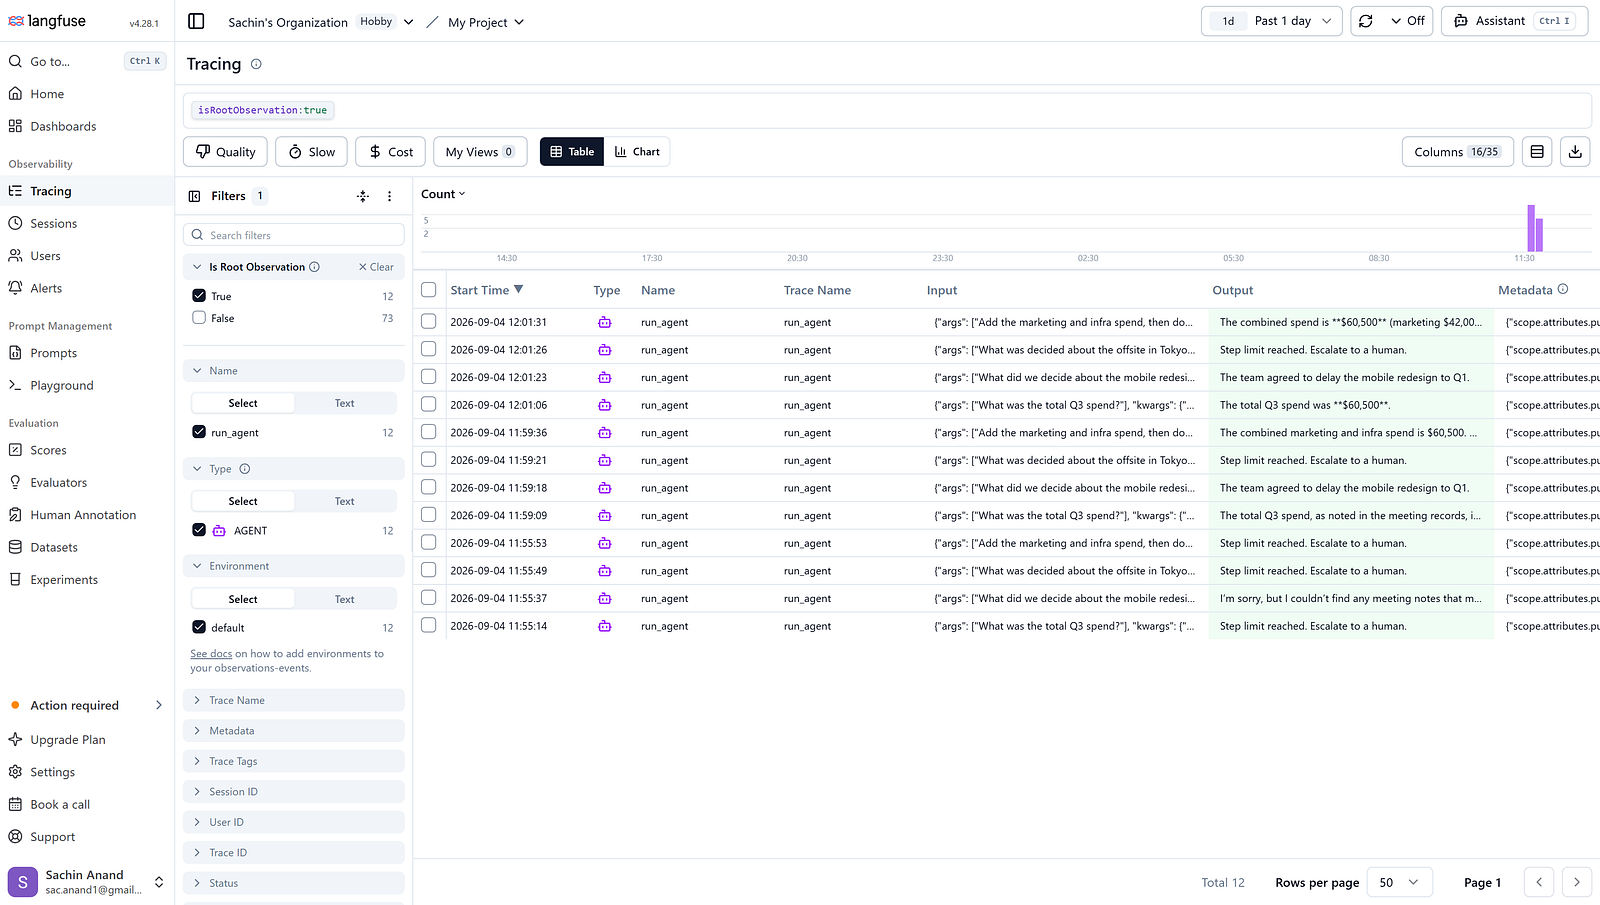
The traces list shows every run of the agentic flow. One row per agent run, with its input and output:
Now open one trace. Inside the trace, you see the agent node, and each tool call under it, with inputs, outputs, and timings:
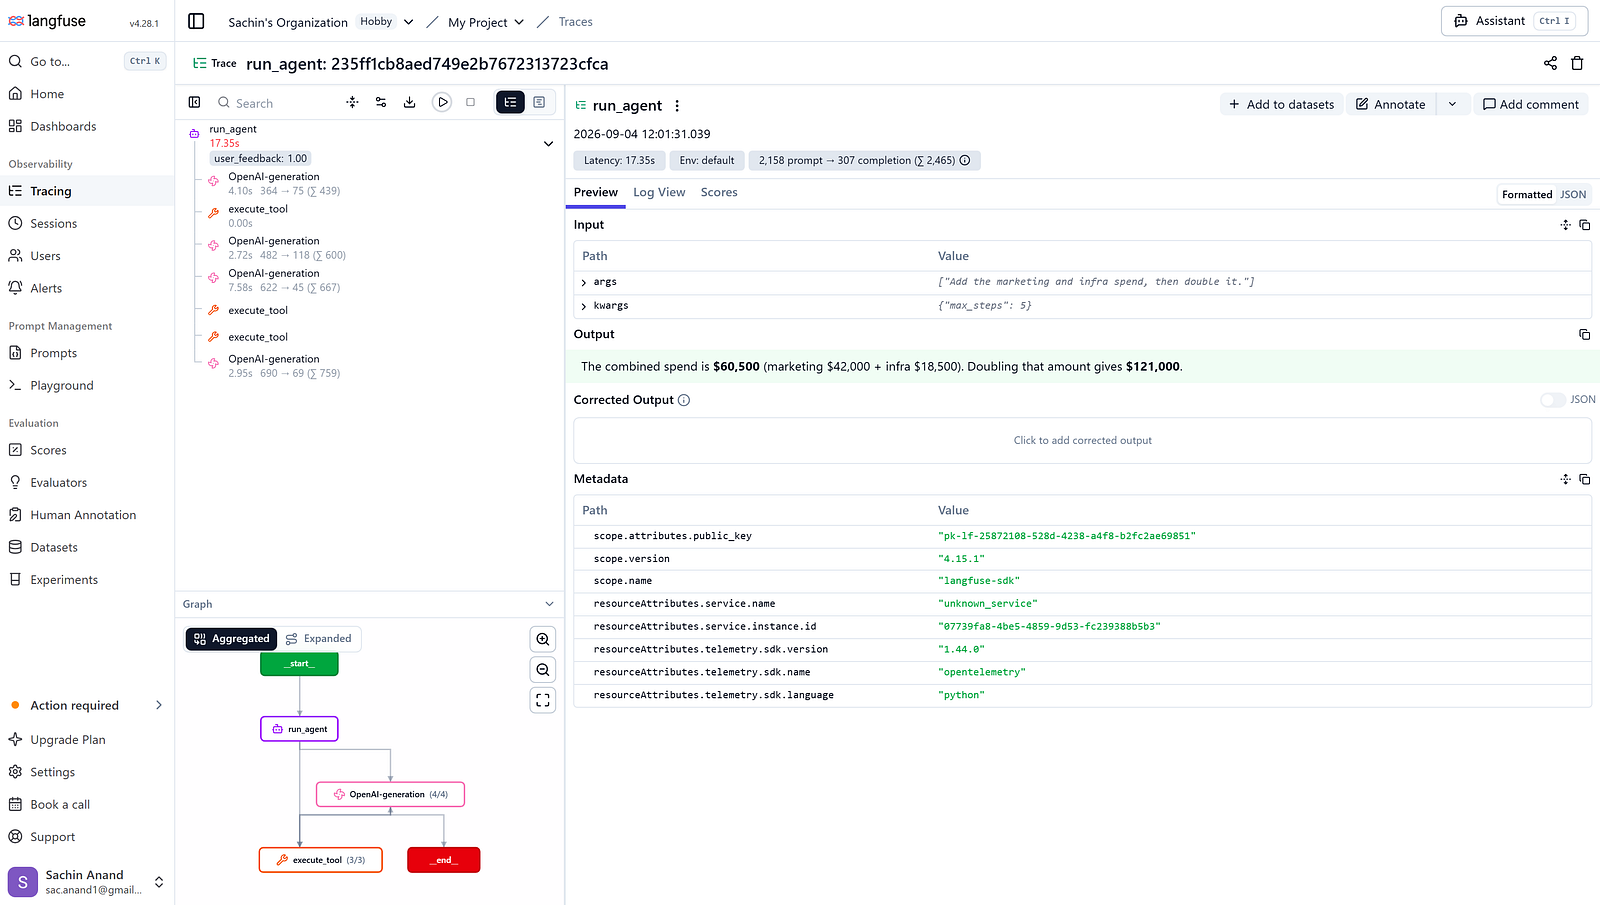
Langfuse automatically renders visual agent graphs from typed observations by analyzing execution timings, nesting structure, or framework integrations. The graph shows the path the agent took. Repeated calls collapse into one node with a counter. Loops appear as cycles.
Here is the agent graph of a real failing run from the demo. The model repeated execute_tool five times and then hit the step limit. In the graph, each repeated step collapses into one node with a counter. The counters show (5/5): five model calls and five identical tool calls. A healthy run would normally show (2/1) or (1/1).
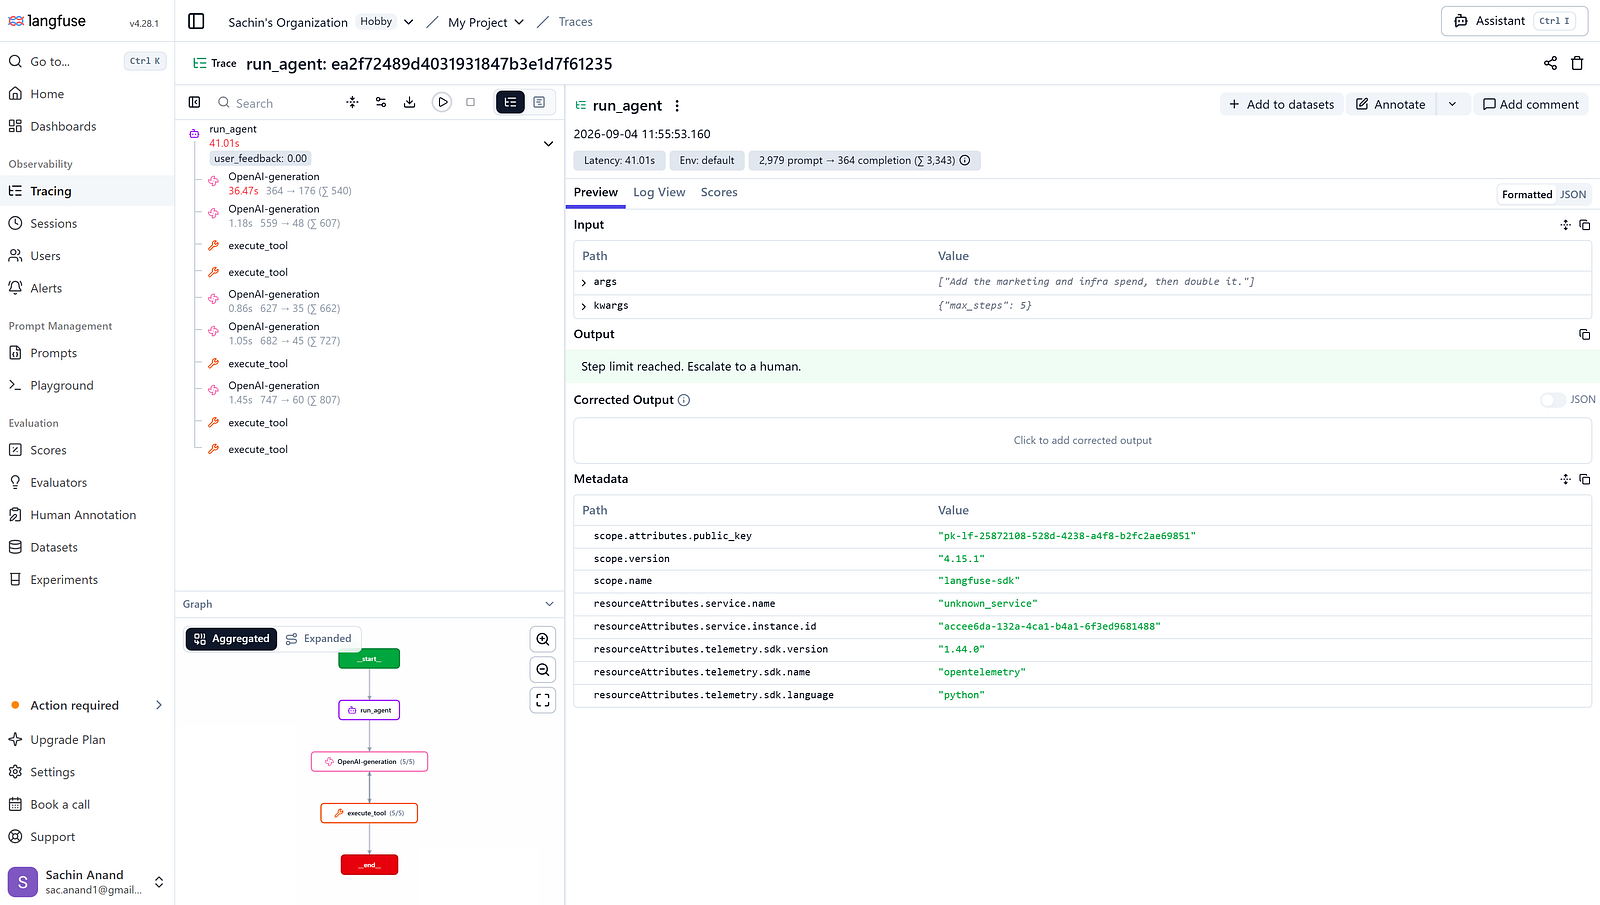
The first version of search_notes matched only the note titles and returned “No notes found.” with no guidance. The trace shows the result: five escalating searches, no answer, a wasted budget.
This view answers the question “why did the agent take many steps for a two-step task” in seconds.
The fix takes one line. Search the note text, and on a miss, tell the model what to search instead:
TOPICS = ", ".join(NOTES.keys())

def search_notes(query: str) -> str:
    words = query.lower().split()
    for key, text in NOTES.items():
        if key in query.lower() or any(w in text.lower() for w in words):
            return text
    return f"No notes found for '{query}'. Available note topics: {TOPICS}."
Run the demo again. The same questions now succeed: the agent finds the notes, calls the calculator, and answers “$121,000” for the spend question. The failing trace stays in the project as permanent evidence of the pattern.
Step 4: Record every model call with full context
The decorator records the structure. Now record the model calls with their prompts, outputs, token counts, and cost. Langfuse provides a drop-in wrapper for the OpenAI client. Change one import:
from langfuse.openai import openaiclient = openai.OpenAI(
base_url="https://openrouter.ai/api/v1",
api_key="sk-or-...",
)That is the complete change. The wrapper behaves like the normal OpenAI client. It records each create() call as a generation observation. Each generation nests under the current agent step. You get the full message history, the tool definitions that were available, the tool calls the model made, and the token cost for every model call.
This step gives you the most important debugging artifact. You can now read what the model actually saw at each step, not what you assume it saw.
Here is one generation from the demo run, opened in the Langfuse UI. It shows the model, the latency, the token usage, the tools that were available (search_notes, calculate), the tool the model actually called, and the full message history the model saw.
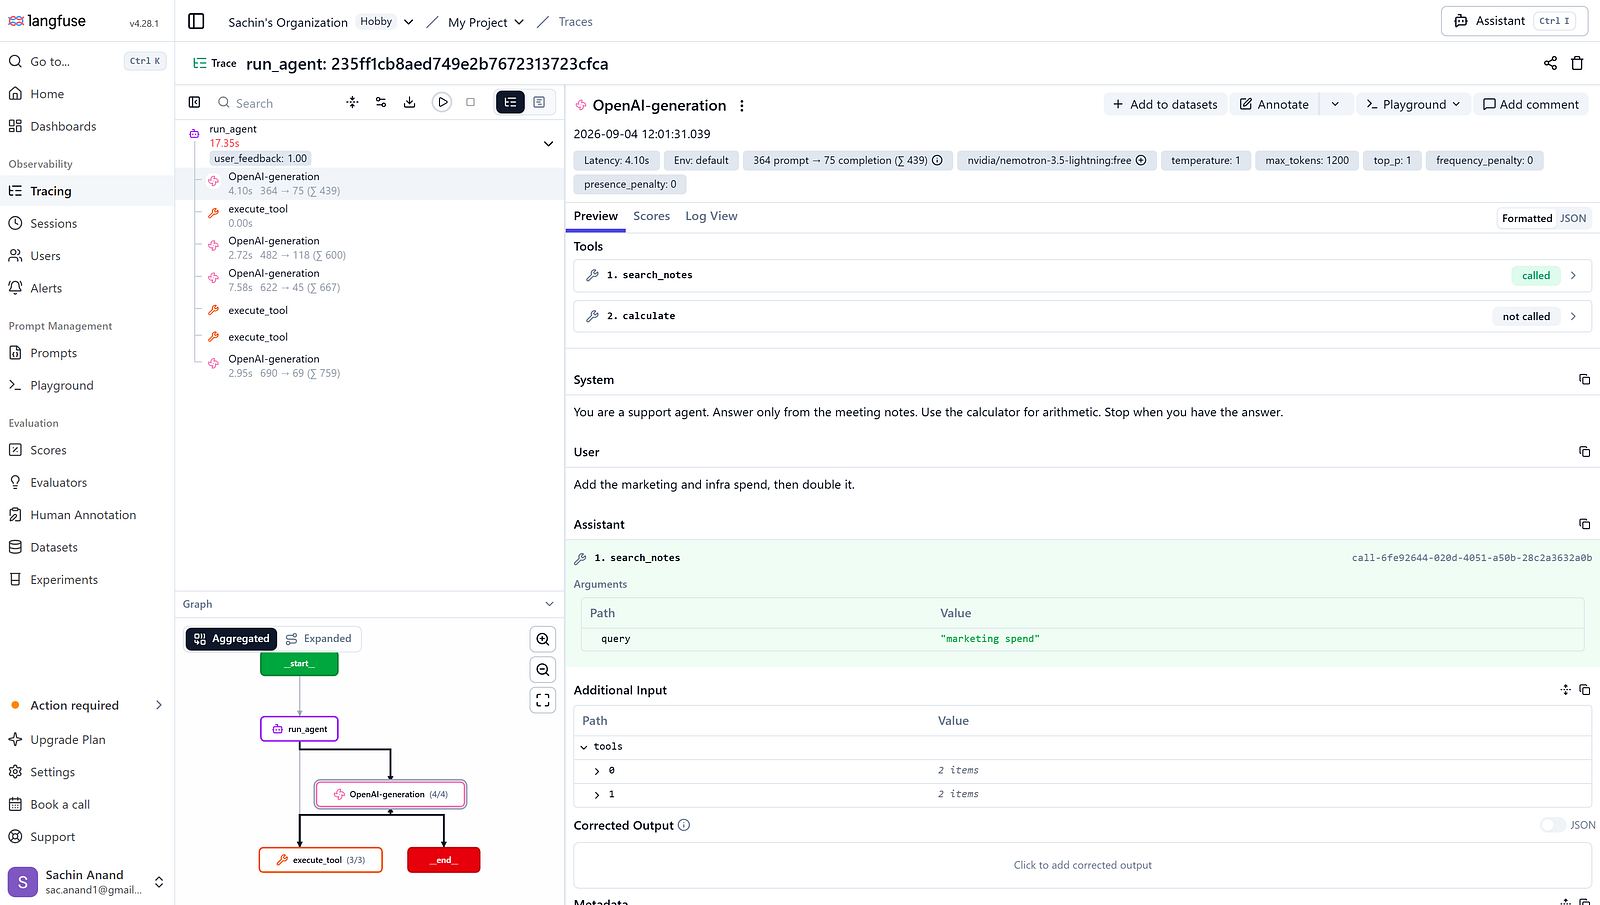
One detail in the screenshot: the observation is named “OpenAI-generation” even though the model is a Nvidia model served through OpenRouter. The name comes from the client wrapper. Langfuse labels the generation after the SDK that made the call, and OpenRouter exposes an OpenAI-compatible API. You can set your own name by passing name=”agent-model-call” inside create().
Step 5: Group runs into sessions
A user conversation spans many agent runs. A session groups these runs. Set the same session ID on every trace of one conversation. In the Langfuse UI, all traces with that ID appear as one timeline.
Use one session per conversation and one trace per agent run. With this structure, you can answer questions per conversation: How many runs did this user need? What did the total cost look like? Where did the workflow repeat the same failing tool call?
from langfuse import observe, propagate_attributes

SESSION_ID = "support-agent-demo-001"

@observe(as_type="agent")
def run_agent(question: str, max_steps: int = 5) -> str:
    with propagate_attributes(session_id=SESSION_ID):
        # the loop from Step 2, unchanged
        ...
Every observation created inside the context manager inherits the session ID. In the Langfuse UI, open the session to replay the whole interaction: each trace is one turn.
Step 6: Measure quality with scores
Traces show behavior. Scores add judgment. A score is a value attached to a trace. Use the SDK:
from langfuse import get_clientlangfuse = get_client()
@observe(as_type="agent")
def run_agent(question: str, max_steps: int = 5) -> str:
...
# the trace is still active here, so this attaches to the current run:
langfuse.score_current_trace(
name="user_feedback", # 1 = helpful, 0 = not helpful
value=1,
)
return final_answerOr, if you prefer scoring after the run, capture the ID inside the function first:
trace_id = langfuse.get_current_trace_id()   # inside run_agent

# later, outside:
langfuse.score(trace_id=trace_id, name="user_feedback", value=1)
Two score types cover most agent needs.
The first is user feedback. Collect a rating in your product and attach it to the trace. The second is an automated check. For example: did the agent call search_notes before it answered? Code checks like this are deterministic. Langfuse supports them as code evaluators.
Prefer binary scores. A score of 1 or 0 forces a clear definition of correct behavior. A score from 1 to 5 hides the definition.
Note for short-lived programs: the SDK sends events in the background. Call langfuse.flush() before the process exits, or you will lose the last events.
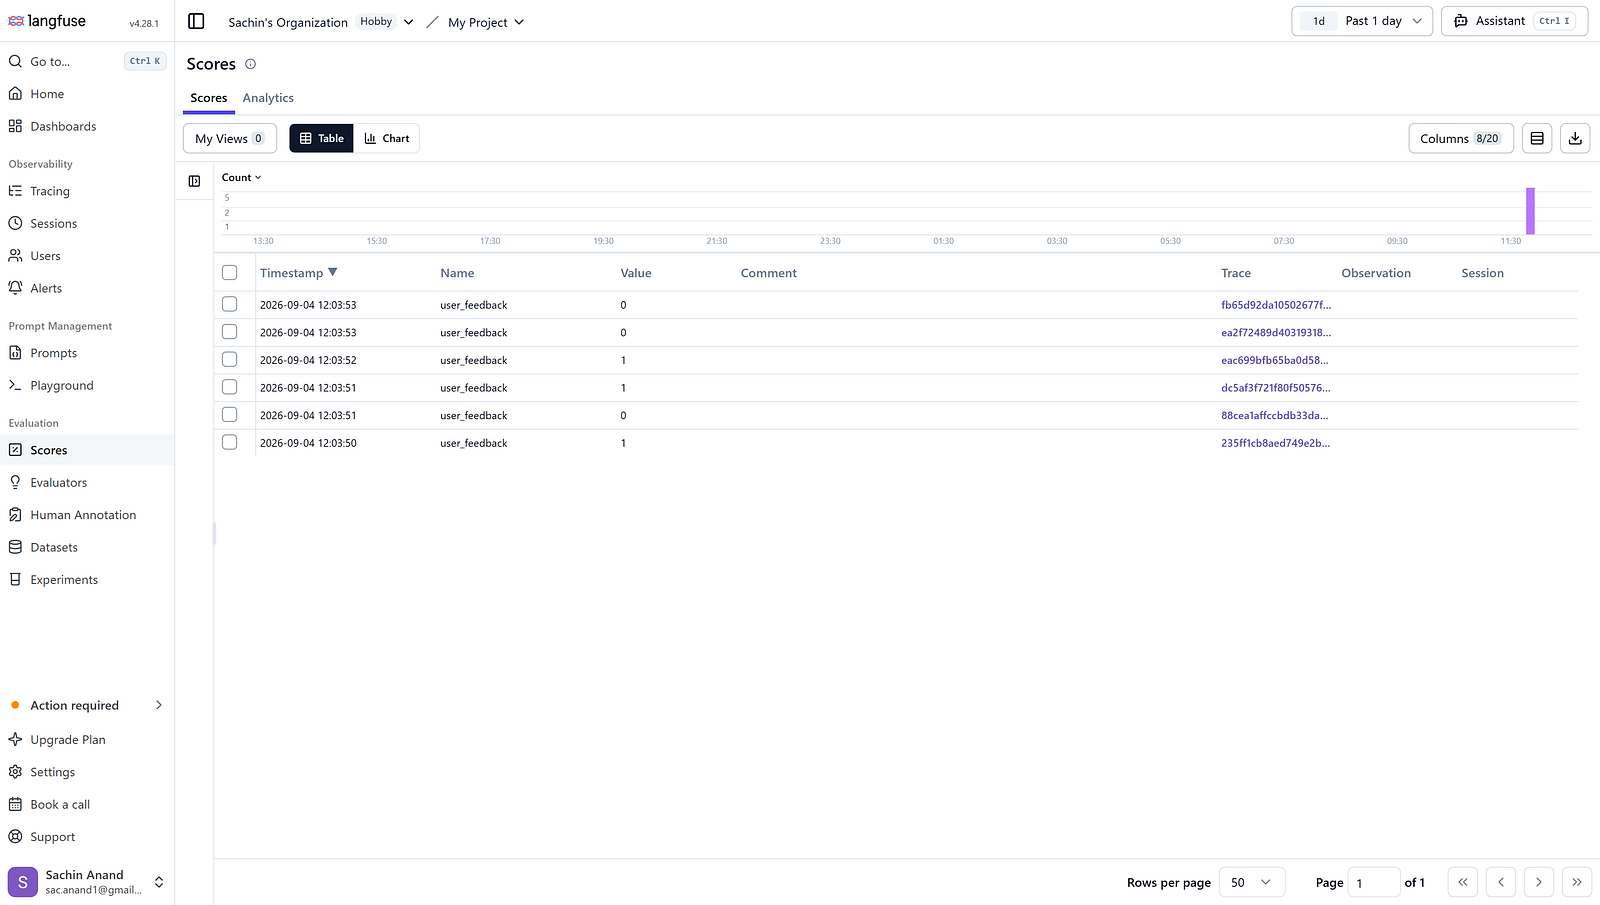
Here are the scores from the demo runs. Three runs scored 1. The escalated runs and the doom-loop run scored 0:
Step 7: Version your prompts
The system prompt drives the agent’s behavior. When you change it, agent paths change. You must know which prompt version produced which trace.
Langfuse stores prompts with versions and labels:
langfuse.create_prompt(
    name="support-agent-system",
    prompt=SYSTEM_PROMPT,
    labels=["production"],
)
prompt = langfuse.get_prompt("support-agent-system")
SYSTEM_PROMPT = prompt.compile()

# in run_agent, pass the prompt object into the create call:
response = client.chat.completions.create(
    model=MODEL,
    messages=messages,
    tools=TOOLS,
    max_tokens=1200,
    langfuse_prompt=prompt,   # links this generation to the prompt version
)
get_prompt returns the version with the production label.
Change the label in the UI to roll out a new version. No code change is required.
Each generation then carries the prompt version that produced it. In the UI, you can compare cost, latency, and scores per version.
Step 8: Turn failures into a test dataset
Production failures are valuable. Do not fix one failing run and forget it. Convert it into a dataset item.
Create a dataset and add items. Each item holds an input and an expected result:
langfuse.create_dataset(name="support-agent-regression")langfuse.create_dataset_item(
dataset_name="support-agent-regression",
input={"question": "What was the total Q3 spend?"},
expected_output="$60,500",
)Collect two kinds of items. The first kind is a real production failure. The second kind is a hand-written edge case. Then run experiments.
Run experiments on this dataset: prompt and model comparisons run directly in the Langfuse UI. To test your own agent function against the dataset, use the SDK’s experiment runner in your code. Either way, you see the results side by side, and a change ships only when the scores hold.
This closes the loop for a non-deterministic system. You cannot replay a run exactly. You can test a change against every failure you have ever recorded.
Step 9: Monitor the running system
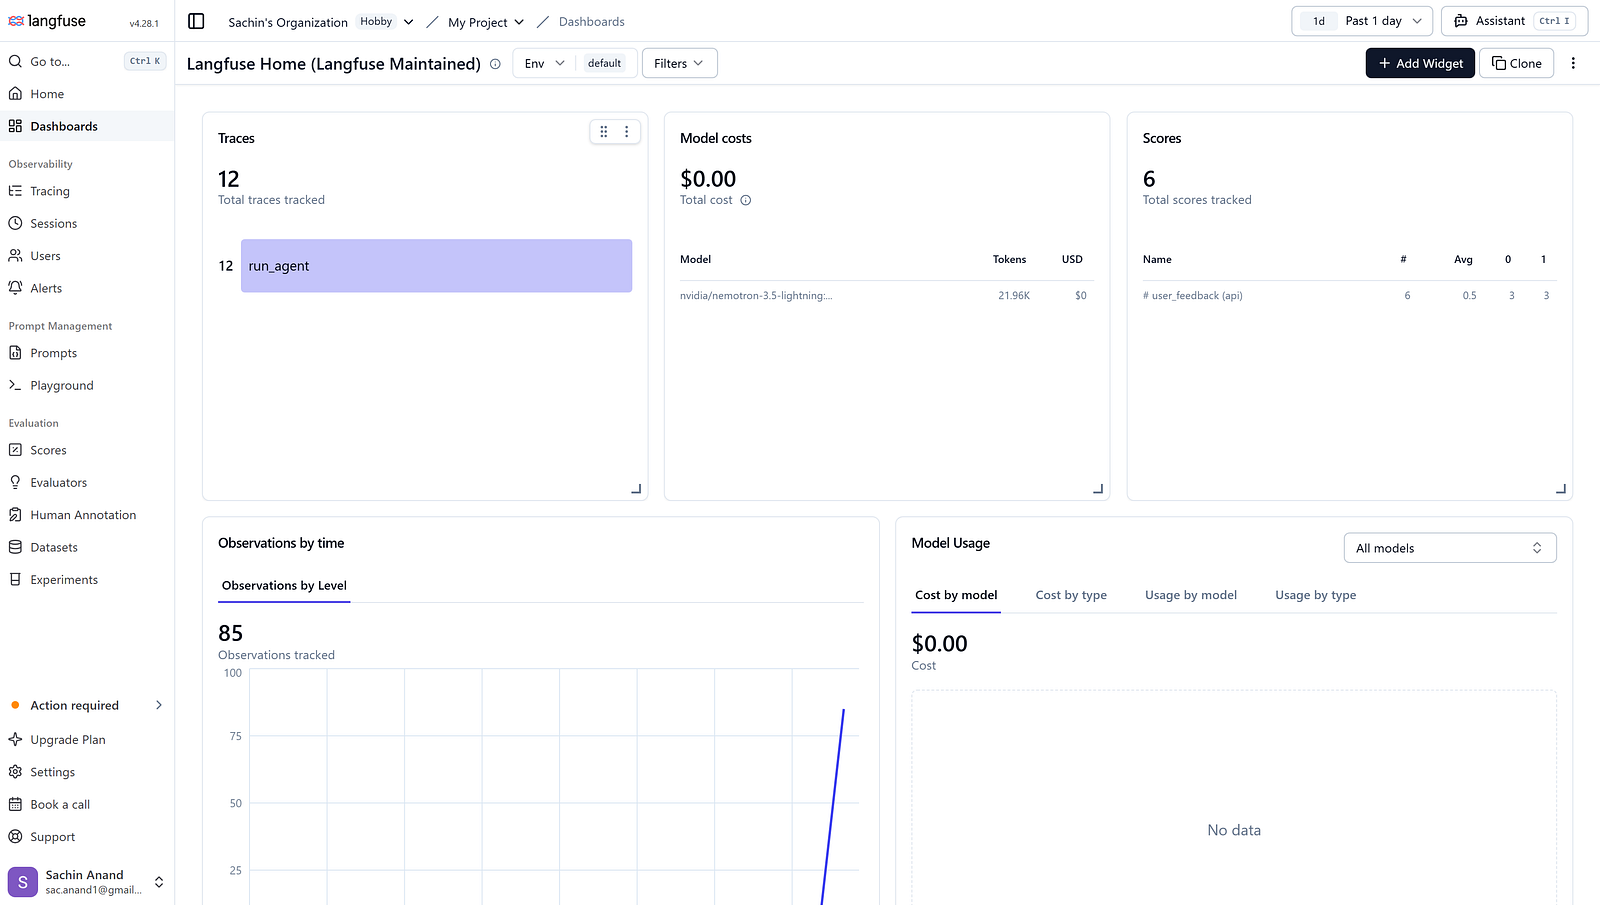
After deployment, you watch aggregates, not single traces. Langfuse dashboards chart cost, latency, volume, and scores over time. Three views carry most of the weight for agent work:
- Cost per trace. Agents choose their own number of model calls. A cost spike is often the first sign of a loop.
- Tool-call counts. Filter for runs with a high tool-call count and a low distinct-tool count. This filter finds doom loops: the agent repeats one failing tool.
- Score trends. A drop in the feedback score after a model or prompt change is a release problem. Catch it with an alert, not with a user complaint.
Langfuse supports alerts on these metrics. The alert sends a message to Slack, a webhook, or GitHub Actions when a metric leaves its expected range.
The preset Langfuse Home dashboard shows traces, cost, scores, and latencies for this project over time:
How to read a trace of a non-deterministic run
Open a failed trace and work in this order:
- Open the agent graph in aggregated mode. Check the shape. A cycle means a loop. A node with a high counter means a repeated step.
- Switch to expanded mode. Follow the run step by step. Find the first observation where the output is wrong.
- Open that generation. Read the full message history. Check which tools were available, which tool the model called, and what the tool returned.
- Write the finding down as a dataset item. The failure is now a permanent test.
Best practices for non-deterministic workflows
The practices below come from the Langfuse documentation and from the patterns in this article:
- One trace per run. One session per conversation.
- Type your observations. Use
agent,tool,retriever, andguardrail, not only generic spans. - Record the available tools and the called tools. The difference between the two sets shows dead tools and wrong choices.
- Score with binary values. Define “correct” precisely.
- Convert every production failure into a dataset item.
- Version prompts from day one. Link them to traces.
- Call
langfuse.flush()in short-lived programs.
Conclusion
A non-deterministic agent does not fail in ways you can replay. It fails in ways you must record. Langfuse gives that record a structure: traces for runs, typed observations for steps, generations for model calls, sessions for conversations, scores for quality, and datasets for regression tests.
The setup in this article takes less than one hour. The payoff starts with the first production failure, when you open the trace and see the exact step where the agent went wrong.
Start with three decorators and one drop-in import. Add scores and datasets when the first real failures arrive.
References
- Langfuse, “AI Agent Observability, Tracing & Evaluation with Langfuse” — langfuse.com/blog/2024–07-ai-agent-observability-with-langfuse
- Langfuse Documentation, Overview — langfuse.com/docs
- Langfuse Documentation, Get Started with Tracing — langfuse.com/docs/observability/get-started
- Langfuse Agent Graphs — langfuse.com/docs/observability/features/agent-graphs
- Langfuse Prompt Management — langfuse.com/docs/prompt-management/get-started